Code Quality: Speed + Comprehensibility

As an engineer, it's extremely important to have a good aesthetic sense of code. At the end of the day, how can a developer write high quality code if they don’t know what that looks like? For many years, I believed that writing high quality code meant making a multivariate optimization toward qualities like efficiency, testability, reliability, readability, modularity, and reusability. While managing trade-offs among those different objectives isn't always easy, this viewpoint had been acceptable. Recently, I found a much simpler approach.

Instead of a multivariate optimization, writing high quality code can be treated as a bivariate optimization between two simple objectives: speed and comprehensibility. Furthermore, because premature optimization is evil and modern hardware is extremely powerful, speed is typically not a concern unless developers are working on core infrastructure or highly responsive user-facing elements. Consequently, writing high quality code essentially becomes writing comprehensible code. In this post, as speed it typically not a concern, I will focus on showing what I mean by comprehensibility, why it trumps other objectives like testability or modularity, and how developers can take advantage of this simple principle to write better code.

What is comprehensibility

While this is subjective, comprehensible code to me means that a completely new developer can understand and modify the codebase quickly and reliably.

Imagine a hypothetical situation in which a developer wants to launch a TCP server. One way to implement it is as follows:

int main() {
  int listenfd;
  struct sockaddr_in servaddr;

  listenfd = socket(AF_INET, SOCK_STREAM,0);
  bzero(&servaddr, sizeof(servaddr));
  servaddr.sin_family = AF_INET;
  servaddr.sin_addr.s_addr = htonl(INADDR_ANY);

  servaddr.sin_port = htons(32000);
  bind(listenfd, (struct sockaddr *)&servaddr, sizeof(servaddr));
  listen(listenfd,1024);
  ....
}

The coding style above is common and quickly leads to a messy and unreadable codebase. Alternatively, consider the following code, in which logic is extracted into separate functions.

int listenfd;
struct sockaddr_in servaddr;

void setup() {
  listenfd = socket(AF_INET, SOCK_STREAM,0);
  bzero(&servaddr, sizeof(servaddr));
  servaddr.sin_family = AF_INET;
  servaddr.sin_addr.s_addr = htonl(INADDR_ANY);

  servaddr.sin_port = htons(32000);
}

void run() {
  bind(listenfd, (struct sockaddr *)&servaddr, sizeof(servaddr));
  listen(listenfd,1024);
  ...
}

int main() {
  setup();
  run();
}

While the code above is much more readable, it is still not very comprehensible. Imagine a new developer wants to add new functionality to the TCP server. He/she likely has to trace the source code from the main() function to the setup() and run() functions, and perhaps deeper and deeper. If the codebase is large and complex, the life of the new developer quickly becomes miserable.

Now, let's consider the following code.

int main() {
  const int PORT = 8080;
  TCPServer *tcpServer = TCPServer::create(PORT);
  tcpServer->start();
}

With better semantical naming, proper encapsulation, and explicit dependencies, the code above becomes much more comprehensible. Readers can simply read the code line by line and understand what each line is exactly doing. In the above example, if the new developer needs to add more functionality to the TCP server, he/she likely doesn't have to trace the source code of TCPServer::create and only has to check out the source code of tcpServer->start.

Generally speaking, when developers need to trace deeper and deeper into the code to understand its functionality, the code is incomprehensible.

Why comprehensibility trumps objectives like modularity, testability, etc.?

First of all, spaghetti code simply can't be comprehensible, and only when the code is modular (not spaghetti), can it be testable, reusable, and reliable. Consequently, code needs to be comprehensible before it can be modular, testable, reusable or reliable. Not to mention that comprehensibility is the foundation of efficient team collaboration. Without it, the entire engineering team will not scale effectively.

For readers who are familiar with the DRY (“don’t repeat yourself”) principle, similar connections can also be drawn. A great definition of this principle can be found on wikipedia

Every piece of knowledge must have a single, unambiguous, authoritative representation within a system

Per the definition, un-DRY code is where a single functionality or knowledge has multiple representations. Such code is not comprehensible. Imagine a new developer trying to change user permissions in a system which has 3 different authorization mechanisms. Before the developer can reliably make the change, he/she has to: a) understand all 3 mechanisms, b) understand how they affect each other and c) invest time into making sure there is no 4th mechanism in the system.

How to improve code comprehensibility

Since this is by itself a huge topic, I will only cover some high level ideas here.

1. write from readers' perspective

To make sure the code is comprehensible, developers really need to wear two hats. In one hat, developers write code that is correct and performs well. In the other hat, developers review the newly written code as if they were completely new to the codebase and see if they can quickly understand it. When reviewing the code, stay honest and keep revising the code until it is comprehensible.

2. understand code smell

"Code smell" are patterns like duplicate code, long methods, etc., which indicate that a program is susceptible to bugs. Code smells typically imply the existence of deeper code structure problems. For instance, 

public class Cache {
  public Cache(int maximumSize, int expireAfterWrite, TimeUnit timeUnit, RemovalListenser removalListener) {
    if (maximumSize > 0) {
      this.maximumSize = maximumSize;
    } else {
      this.maximumSize = DEFAULT_MAXIMUM_SIZE;
    }
    if (expireAfterWrite > 0) {
      this.expireAfterWrite = expireAfterWrite;
      this.timeUnit = timeUnit;
    } else {
      this.expireAfterWrite = 10;
      this.timeUnit = TimeUnit.MINUTES;
    }
    if (removalListener != null) {
      this.removalListener = removalListener;
    } else {
      this.removalListener = DUMMY_REMOVAL_LISTENER;
    }
  }
  ...
}
In the code above, the constructor is smelly as the implementation is not only long but also contains many branching logic. By introducing a separate builder class and move the logic of handling the optional parameters into builder’s instance methods, the code becomes much more comprehensible
public class Cache { ... }
public class CacheBuilder {
  public CacheBuilder maximumSize(int maximumSize) {...}
  public CacheBuilder expireAfterWrite(int expireAfterWrite, TimeUnit timeUnit) {...}
  public CacheBuilder removalListener(RemovalListener removalListener) {...}
  
  public Cache build() { ... }
}

While identifying a code smell’s underlying cause can be challenging, understanding code smells helps developers sharpen their radar for detecting incomprehensible code. 

3. keep your code DRY

For effective collaboration in the physical world, you want clear task ownership and accountability. In code, each component or module should also have clearly defined ownership and responsibilities. Ambiguities will quickly compound and result in an incomprehensible codebase.

4. have consistent convention

From my personal experience, many developers keep consistent conventions for the sake of complying with company policy. However, proper conventions also helps comprehensibility tremendously. At the framework level, this is how Rails, Maven, etc. achieve simplicity. At the business logic level, consider the following snippet.

StatusCode authorize(const Policy &policy, const User &user, Response *response) {
  ....
}

Having common C++ conventions like “input parameters must be value or const references and output parameters must be non-const pointers” helps readers better understand method signatures and other developers’ intentions.

5. understand design patterns

While most developers think of design patterns as best practices to dis-entangle spaghetti code into modular components, another advantage of applying design patterns is to give developers a common vocabulary to communicate with. For instance, when a developer sees a class called UserPresenter, he/she can directly infer that the class is adopting the Presenter pattern for the User model, i.e. Decorator of the User model for view-specific logic.

6. adopt dependency injection

This tip is more controversial and heavily depends on the language and the framework. Nevertheless, I find the fundamental idea still worth sharing.

Many years ago, developers began adopting dependency injection (DI) in Java for better testability. For more static language like Java, DI is particularly important as it allows developers to inject mock objects during tests while injecting real objects in production. Consequently, DI greatly enhanced testability. However, this success has led people to believe that dependency injection is only for improving testability in static languages. I want to demonstrate that dependency injection is much more than testability, and that there are at least three ways it improves the code comprehensibility. 

First, it makes the dependency explicit so that readers don't have to trace the implementation to uncover it. For instance, in the following code, the reader can infer that for a Computer to exist, it needs a valid RAM and a valid Disk for its entire lifetime.

public class Computer {
  public Computer(RAM ram, Disk disk) {
    ...
  }
}
In the following code, however, the reader needs to trace the implementation of the constructor for the same information.
public class Computer {
  public Computer() {
    ...
    Disk disk = new Disk();
    ...
    RAM ram = new RAM();
    ...
  }
}

Second, DI prompts the developer to think about an object’s life cycle. For instance, whether A depends on B during the entire lifetime or just during the execution of certain tasks. For instance, 

public class Computer {
  public Computer(RAM ram, Disk disk) {
    ...
  }
  public print(Printer printer, File file) {
    ...
  }
}
vs
public class Computer {
  public Computer(RAM ram, Disk disk, Printer printer) {
    ...
  }
  public void print(File file) {
    ...
  }
}

Finally, DI separates object creation logic from business logic. This is particularly important as it not only simplifies the implementation, but also simplifies the transitive dependency needed for creating the dependency. Moreover, from the reader's perspective, code will be much more comprehensible if readers can focus on business logic rather than creation logic. For instance,

public class Computer {
  public Computer(RAM ram, Disk disk) {
    ...
  }
  public print(Printer printer, File file) {
    printer.print(disk.loadContent(file));
  }
}
vs
public class Computer {
  public Computer(RAM ram, Disk disk) {
    ...
  }
  public void print(Ink ink, Toner toner, Document document) {
    Printer printer = null;
    if (config.useLaserPrinter()) {
      printer = new LaserPrinter(toner);
    } else if (config.userInkPrinter()) {
      printer = new InkPrinter(ink);
    }
    printer.print(disk.loadContent(file));
  }
}

Conclusion

To sum up, developers should strive to make their code fast and comprehensible. While premature optimization is evil and modern hardware is extremely powerful, oftentimes, developers only need to worry about code comprehensibility. In this post, we talked about how comprehensible code looks, why it's a top priority, and some high level ideas for writing more comprehensible code. While this post is not exhaustive, I want to illustrate the importance of comprehensibility, and I will cover more details in separate posts. Lastly, for readers who only want to walk out with one idea, just remember the following. 

Your code should read like a story in which each line should clearly tell the reader what they do. If you do it right, you don't even need comments.

If you like the post, you can follow me (@chengtao_chu) on Twitter or subscribe to "ML in the Valley". Also, special thanks Leo Polovets for reading a draft of this.
A/B testing - statistical hypothesis testing or multi-armed bandit

With the emergence of lean startup and big data, more and more companies are embracing A/B testing. While it’s encouraging that the industry is starting to statistically test features using data, very few are aware of an superior alternative to traditional statistical hypothesis testing:multi-armed bandit. In this post, I will give an overview as to why multi-armed bandit is superior to hypothesis testing for a majority of applications. For readers who are not familiar with why testing features with data is important, more details can be found in "Bridging the gap between lean startup in theory and in practice."  For readers who are looking for social proof, multi-armed bandit solution is also what Google Analytics has adopted for their new content experiment.

Overview of statistical hypothesis testing

The objective of hypothesis testing in A/B testing is to tell whether the difference of conversion rates observed can be explained away by chance. The standard methodology involves

  1. Calculating the sampling distribution under the null hypothesis
  2. Calculating the likelihood of the observed difference under the sampling distribution, and
  3. Compare the probability against the pre-determined threshold.

While intuitive at first glance, it actually requires substantial statistical knowledge to design and interpret the experimental result properly. For instance,

  • How to bound type II error?
  • How to test more than two treatments simultaneously? 
  • How many observations are required? 
  • What are the right thresholds?
  • Is it ok to peek into the results and early terminate the experiment?

Overview of multi-armed bandit

The name "multi-armed bandit" describes a scenario in which a gambler faces several slot machines, a.k.a., “one-armed bandit", with different expected payouts. The objective is to maximize the total reward earned through a sequence of lever pulls. To achieve the objective, the multi-armed bandit solution adaptively balances the cost to gather information of the uncertain levers by playing them (exploration) with the cumulative rewards from playing the known good arms (exploitation).

In the context of A/B testing, each slot machine represents a treatment in the experiment, each play represents an impression to a treatment, and the cumulative reward represents the cumulative conversions. While there are many different algorithms, e.g. UCB, epsilon-greedy, etc, in this post, we will focus on one algorithm called "Thompson sampling".

High level overview of Thompson sampling

The idea behind Thompson sampling is very simple. The algorithm maintains the posterior distribution of the payout rate of each arm, plays the arm in proportion to the probability that the given arm is optimal under the posterior, and then update the posterior as new observations are made. For example, for two treatments which have 10/150 and 5/100 conversions over impressions observed, the posterior conversion rate distributions would be Beta(10, 140) and Beta(5, 95). Now, instead of deterministically playing the first treatment which has higher conversion rate for subsequent trials, Thompson sampling stochastically plays the first treatment with P(1st treatment is the best treatment) and plays the second treatment with P(2nd treatment is the best treatment) under the current posterior conversion rate distribution. Lastly, update the posterior distribution as new observations are made. For readers who are not familiar with Bayesian statistics, Beta distribution is often used as the conjugate prior distribution to Binomial distribution, which is used to model the conversion rates.

Comparison

Now, with the basic understanding of both problem formulations and solutions, let's compare them. 

1. Thompson sampling is simple

To properly interpret statistical hypothesis testing, practitioners need to have a good understanding of basic statistical testing, power analysis, bias correction when peeking into results, bias correction when dealing with multiple treatments, etc. On the other hand, practitioners only need to understand basic Bayesian statistics to understand Thompson sampling. Simpler concept makes the interpreting the results much less error-prone.

2. Thompson sampling directly estimates the probability of which arm is optimal

Statistical hypothesis testing tries to answer the question of "what's the probability of observing situation as extreme assuming all treatments have the same conversion rate." On the other hand, Thompson sampling tries to answer the question of "given the observation, what is the probability of each given arm is optimal." While both questions are valid but Thompson sampling is much easier to understand and it naturally balances the tradeoff between type I and type II errors.

3. multi-armed bandit typically converges much faster

As multi-armed bandit solutions are adaptive, the number of trials required to identify the best arm (if it exists) is typically much lower than the number of trials needs for statistical hypothesis testing. However, it does imply that a separate stopping criterion is needed when all treatments are about the same.

4. multi-armed bandit generalizes naturally with multiple treatments

This is really where multi-armed bandit shines. Since multi-armed bandit is adaptive, it can quickly determine which arms are less likely to be the optimal ones and play those inferior arms with lower probability. On the other hand, in statistical hypothesis testing, each treatment is allocated the same numbers of trials determined by the power analysis before the experiment.

To sum up, multi-armed bandit has many practical advantages over traditional statistical hypothesis testing. It typically converges much faster, allows less room for misinterpretation, generalizes better for multiple treatments and requires less tuning parameters. For startups who are serious about A/B testing, multi-armed bandit is strongly recommended. 

 If you like the post, you can follow me (@chengtao_chu) on Twitter or subscribe to my blog "ML in the Valley" Also, special thanks Ian Wong (@ihat) and Bob Ren (@bobrenjc93) for reading a draft of this.

Machine Learning Done Wrong

Statistical modeling is a lot like engineering.

In engineering, there are various ways to build a key-value storage, and each design makes a different set of assumptions about the usage pattern. In statistical modeling, there are various algorithms to build a classifier, and each algorithm makes a different set of assumptions about the data.

When dealing with small amounts of data, it’s reasonable to try as many algorithms as possible and to pick the best one since the cost of experimentation is low. But as we hit “big data”, it pays off to analyze the data upfront and then design the modeling pipeline (pre-processing, modeling, optimization algorithm, evaluation, productionization) accordingly.

As pointed out in my previous post, there are dozens of ways to solve a given modeling problem. Each model assumes something different, and it’s not obvious how to navigate and identify which assumptions are reasonable. In industry, most practitioners pick the modeling algorithm they are most familiar with rather than pick the one which best suits the data. In this post, I would like to share some common mistakes (the don't-s). I’ll save some of the best practices (the do-s) in a future post.

1. Take default loss function for granted

Many practitioners train and pick the best model using the default loss function (e.g., squared error). In practice, off-the-shelf loss function rarely aligns with the business objective. Take fraud detection as an example. When trying to detect fraudulent transactions, the business objective is to minimize the fraud loss. The off-the-shelf loss function of binary classifiers weighs false positives and false negatives equally. To align with the business objective, the loss function should not only penalize false negatives more than false positives, but also penalize each false negative in proportion to the dollar amount. Also, data sets in fraud detection usually contain highly imbalanced labels. In these cases, bias the loss function in favor of the rare case (e.g., through up/down sampling).

2. Use plain linear models for non-linear interaction

When building a binary classifier, many practitioners immediately jump to logistic regression because it’s simple. But, many also forget that logistic regression is a linear model and the non-linear interaction among predictors need to be encoded manually. Returning to fraud detection, high order interaction features like "billing address = shipping address and transaction amount < $50" are required for good model performance. So one should prefer non-linear models like SVM with kernel or tree based classifiers that bake in higher-order interaction features.

3. Forget about outliers

Outliers are interesting. Depending on the context, they either deserve special attention or should be completely ignored. Take the example of revenue forecasting. If unusual spikes of revenue are observed, it's probably a good idea to pay extra attention to them and figure out what caused the spike. But if the outliers are due to mechanical error, measurement error or anything else that’s not generalizable, it’s a good idea to filter out these outliers before feeding the data to the modeling algorithm.

Some models are more sensitive to outliers than others. For instance, AdaBoost might treat those outliers as "hard" cases and put tremendous weights on outliers while decision tree might simply count each outlier as one false classification. If the data set contains a fair amount of outliers, it's important to either use modeling algorithm robust against outliers or filter the outliers out.

4. Use high variance model when n<<p

SVM is one of the most popular off-the-shelf modeling algorithms and one of its most powerful features is the ability to fit the model with different kernels. SVM kernels can be thought of as a way to automatically combine existing features to form a richer feature space. Since this power feature comes almost for free, most practitioners by default use kernel when training a SVM model. However, when the data has n<<p (number of samples << number of features) --  common in industries like medical data -- the richer feature space implies a much higher risk to overfit the data. In fact, high variance models should be avoided entirely when n<<p.

5. L1/L2/... regularization without standardization

Applying L1 or L2 to penalize large coefficients is a common way to regularize linear or logistic regression. However, many practitioners are not aware of the importance of standardizing features before applying those regularization.

Returning to fraud detection, imagine a linear regression model with a transaction amount feature. Without regularization, if the unit of transaction amount is in dollars, the fitted coefficient is going to be around 100 times larger than the fitted coefficient if the unit were in cents. With regularization, as the L1 / L2 penalize larger coefficient more, the transaction amount will get penalized more if the unit is in dollars. Hence, the regularization is biased and tend to penalize features in smaller scales. To mitigate the problem, standardize all the features and put them on equal footing as a preprocessing step.

6. Use linear model without considering multi-collinear predictors

Imagine building a linear model with two variables X1 and X2 and suppose the ground truth model is Y=X1+X2. Ideally, if the data is observed with small amount of noise, the linear regression solution would recover the ground truth. However, if X1 and X2 are collinear, to most of the optimization algorithms' concerns, Y=2*X1, Y=3*X1-X2 or Y=100*X1-99*X2 are all as good. The problem might not be detrimental as it doesn't bias the estimation. However, it does make the problem ill-conditioned and make the coefficient weight uninterpretable.

7. Interpreting absolute value of coefficients from linear or logistic regression as feature importance

Because many off-the-shelf linear regressor returns p-value for each coefficient, many practitioners believe that for linear models, the bigger the absolute value of the coefficient, the more important the corresponding feature is. This is rarely true as (a) changing the scale of the variable changes the absolute value of the coefficient (b) if features are multi-collinear, coefficients can shift from one feature to others. Also, the more features the data set has, the more likely the features are multi-collinear and the less reliable to interpret the feature importance by coefficients.

So there you go: 7 common mistakes when doing ML in practice. This list is not meant to be exhaustive but merely to provoke the reader to consider modeling assumptions that may not be applicable to the data at hand. To achieve the best model performance, it is important to pick the modeling algorithm that makes the most fitting assumptions -- not just the one you’re most familiar with.

If you like the post, you can follow me (@chengtao_chu) on Twitter or subscribe to my blog "ML in the Valley" Also, special thanks Ian Wong (@ihat) for reading a draft of this. 

Bridging the gap between lean startup in theory and in practice

While the Lean Startup methodology lays out a great foundation to guide startup product development, applying it in practice remains challenging. When a startup first adopts Lean Startup principles, there are many initial questions. What is our MVP? What hypotheses should we test? How do we test those hypotheses? How do we convince the team to embrace this method? In this post, I would like to share my experience answering those questions.

Here’s a quick refresher on lean startup (courtesy of Wikipedia):

"Lean startup" is a method for developing businesses and products first proposed in 2011 by Eric Ries. Based on his previous experience working in several U.S. startups, Ries claims that startups can shorten their product development cycles by adopting a combination of business-hypothesis-driven experimentation, iterative product releases, and what he calls "validated learning". Ries' overall claim is that if startups invest their time into iteratively building products or services to meet the needs of early customers, they can reduce the market risks and sidestep the need for large amounts of initial project funding and expensive product launches and failures

At the core of “lean startup” is the idea that startups should release their “Minimum Viable Product” as quickly as possible instead of building a full featured product before launching to the market. Startups should identify and validate their key hypotheses by running cheap experiments instead of iteratively improving the product based on gut feeling. One of the key benefits to this approach is that startup founders are forced to think about key hypotheses upfront, which enables startups to have a cohesive strategy and validate hypotheses in cheap, quick and creative ways.

As an example, let’s compare Google Drive and Dropbox. Back in 2008, Google Drive was already a working Dropbox-like product that was used internally. After years of development, it became tightly integrated with Google Docs and the development was primarily driven by internal feedback. The product was finally launched in early 2012, and only receiving market feedback then. For most startups, this type of product strategy would bear overwhelming market risk, building a product that has no target audience. In contrast, instead of building the full featured product, Drew Houston, CEO of Dropbox, came up with a clever way to validate their key market hypotheses. He made a 3-minute video where he walked through how the product works, posted it on Hacker News, and watched the waiting list explode from 5,000 to 75,000 people overnight.

With the aforementioned context, let’s now dive into answering the initial lean startup questions we surfaced earlier.

1. what hypothesis to test first

Given that every startup’s runway is limited, what to validate first is a do-or-die question. Hypotheses vary in importance and ease of testing. Without holistic product thinking, testing low impact hypotheses will quickly lead to local optimization. For instance, testing email subject lines to optimize email open rate is probably going to be low impact, and shouldn’t be a focus before product/market fit. Also, hypotheses can be interdependent, and premature optimization could lead to suboptimal product impact. For example, optimizing growth before having reasonable retention eventually leads to increased unretained users; optimizing paid customer acquisition before having reasonable customer lifetime value might jeopardize cash flow.

Return on investment is probably the most adopted principle for prioritization. With the spirit of being lean, startups should always try to validate the highest impact hypothesis with the cheapest experiment. In some cases, estimating potential return before the fact could be another challenging problem. Two simple alternatives are either designing a separate experiment to estimate the potential impact or focusing energy on the most risky hypotheses. From the hindsight, focusing on the most risky hypothesis is the exact reason why most consumer facing companies want to prove sustainable growth before any other thing.

2. how to test big hypotheses

Testing big hypotheses is crucial for early stage startups, but they are also the most difficult to validate. Breaking a big hypothesis down into testable pieces typically results in cheaper individual experiments. For instance, say Codecademy wants to test a hypothesis of “there are X number of mobile users who want to learn coding with their mobile devices” and it would be difficult to test in a single experiment. Breaking that into two smaller hypotheses (a) “there are Y number of users who intend to learn coding” and (b) “ Z% of them would learn with their mobile devices” makes testing much easier. Especially since the company may already be familiar with Y, the size of the addressable market, and could approximate Z separately by the percentage of Codecademy users using their mobile devices.

It's not difficult to see that how to break down a big hypothesis is more art than science. In my opinion, it's a tradeoff among how accurate it is, how easy to test, and how fast to get feedback. 

3. how to come up with a cheap experiment

The most expensive type of experiment to validate a hypothesis is to fully build the feature and then measure the performance. It is often worth exploring cheaper alternatives. A well-known example is what ex-CEO of Zynga Mark Pincus described as ghetto testing, which tests the size of a potential market by (a) making a banner ad for a new game idea before the game is implemented, (b) putting the ad on Zynga’s site for a while, (c) measuring the number of clicks, and (d) prioritizing game ideas based on the number of clicks. Though not perfect, it is a reasonable approximation. In practice, not all hypotheses are as easy to test as ghetto testing. In some cases, hypotheses could be validated quickly through market research or ghetto testing. In other cases, another popular approach is to build a so-called concierge MVP, which take inefficient approaches to solving a problem for the sake of getting rapid feedback. For instance, a concierge MVP for a daily coupon site may not crawl the coupons from the web automatically. As long as the website looks nice, coupons can be manually curated at the beginning so that the level of demand is validated. The idea is to design cheap experiments, and only build the feature if none of the alternatives work.

4. what metric should be used

In order to validate or falsify a hypothesis at the end of the experiment, we need to come up with a metric upfront that reflects the impact of the hypothesis. At first glance, it seems reasonable to use Key Performance Indicators (KPIs) such as retention rate or subscription rate. At the end of the day, these KPIs make or break a startup. But it doesn’t take long to notice that most experiments simply won’t move the needle when measured by the KPIs. The problem comes from not understanding the fine-grained results that the experiment yields.

Suppose Codecademy is testing whether offering real-time help on exercise pages would help users to complete exercises and thus increase user retention. One experiment is to (a) place test learners into either a control or a treatment group when they first hit an exercise page, (b) only show the real-time help button to users in the treatment group, and (c) test the difference in retention rates between the two groups. While this may seem fair, there are two major problems with the setup. First, there are many factors which could affect the retention rate simultaneously. Thus, it is possible that even if learners love realtime help, their retention rate might not reflect that. Second, not all users in treatment group have the intention to engage with the feature. If only 1% of users get stuck and need real-time help, even if those users found realtime help to be extremely useful, the effect to the retention rate of the entire group could be low. Alternatively, a hypothetical experiment setting would be, on each exercise page, offer a "get help" button, and for users who click the button, slot them into either the control group which shows "Sorry, but the help information for the current exercise is not available", or the treatment group which shows the real-time help feature. Then measure three metrics:

  1. The number of users who clicked the button, which reflects the size of the target audience.
  2. The difference in exercise completion rates between the two groups, which reflects the effect of the feature.
  3. The difference in retention rates between the two groups, which reflects the causal relationship between exercise completion and retention.

Of the three metrics, only the second assesses the effectiveness of real-time help would affect learners or not. But it’s important to note that the experiment only makes sense if the first and third metrics are high. If there is no strong evidence that many people need help or that exercise completion affects retention, it might not make sense to even run the experiment. Therefore, a good metric for measuring effectiveness should be the conversion rate between users who "intend" to engage with the feature and users who actually "engage and benefit" from it. To make a compelling hypothesis, the target audience size for the feature should be large and the desired effect should be a leading indicator to a KPI.

5. how to interpret the result properly

When it comes to hypothesis validation, most people jump straight to thinking about A/B testing and whether the metric difference is statistically significant. In practice, it's much harder than that. I plan to cover more details in a future post, but let me share some high level ideas here:

  1. As the number of samples increase, any small difference becomes statistically significant. So the question shouldn’t be whether the difference is significant but rather whether the difference is meaningful.
  2. Type I error, false positive, matters less than people might expect. In traditional drug testing, Type I error matters because it means claiming some drug to be effective while it's not. However, when testing a signup page, if we observed and falsely claimed the red signup button outperforms the green signup button, it is unlikely the the green button outperforms the red one with a meaningful margin and chances are the color of the button doesn't make meaningful difference.
  3. Type II error, false negative, matters more than people might expect. In traditional drug testing, type II error matters less than type I error because it means claiming some drug to be ineffective while it's effective. However, if a website falsely dismissed features that help their KPI, those are missed opportunities. Type II error needs to be bounded, which can be done through a power analysis.
  4. Traditional statistical testing is not adaptive as the experiment collects more and more information. Comparing to more adaptive approaches like multi-armed bandit, traditional statistical testing might not converge as efficiently and might require pre-determined base rate and expected effect size before the experiment begins.

To sum up, the lean startup philosophy lays out a great foundation for product development as iterative hypothesis validation. As the product collects more data from the customers, startups can learn more about what customers really want. This post is meant to share some common challenges I have seen when startups start to apply this philosophy, and to propose some ideas to deal with those challenges accordingly. As always, there are definitely blind spots and clever solutions that I'm not aware of. Feedback is highly welcome.

If you like the post, you can follow me (@chengtao_chu) on Twitter or subscribe to my blog "ML in the Valley" Also, special thanks Ian Wong (@ihat), Leo Polovets, and Bob Ren (@bobrenjc93) for reading a draft of this. 

EventHub: Open-sourced Funnel analysis, Cohort analysis and A/B testing tool

As product development becomes more and more data driven, the demand for essential data analysis tools has surged dramatically. Today, we are excited to announce that we've open sourced EventHub, an event analysis platform that enables startups to run their funnel and cohort analysis on their own servers. Getting EventHub deployed only requires downloading and executing a jar file. To give you a taste of what EventHub can do, we set up a demo server to play on located here - demo server with example funnel and cohort analysis queries.

EventHub was designed to handle hundreds of events per seconds while running on a single commodity machine. With EventHub, you don’t need to worry about pricy bills. We did this to make it as frictionless as possible for anyone to start doing essential data analysis. While more details can be found from our repository, the following are some key observations, assumptions, and rationales behind the design.


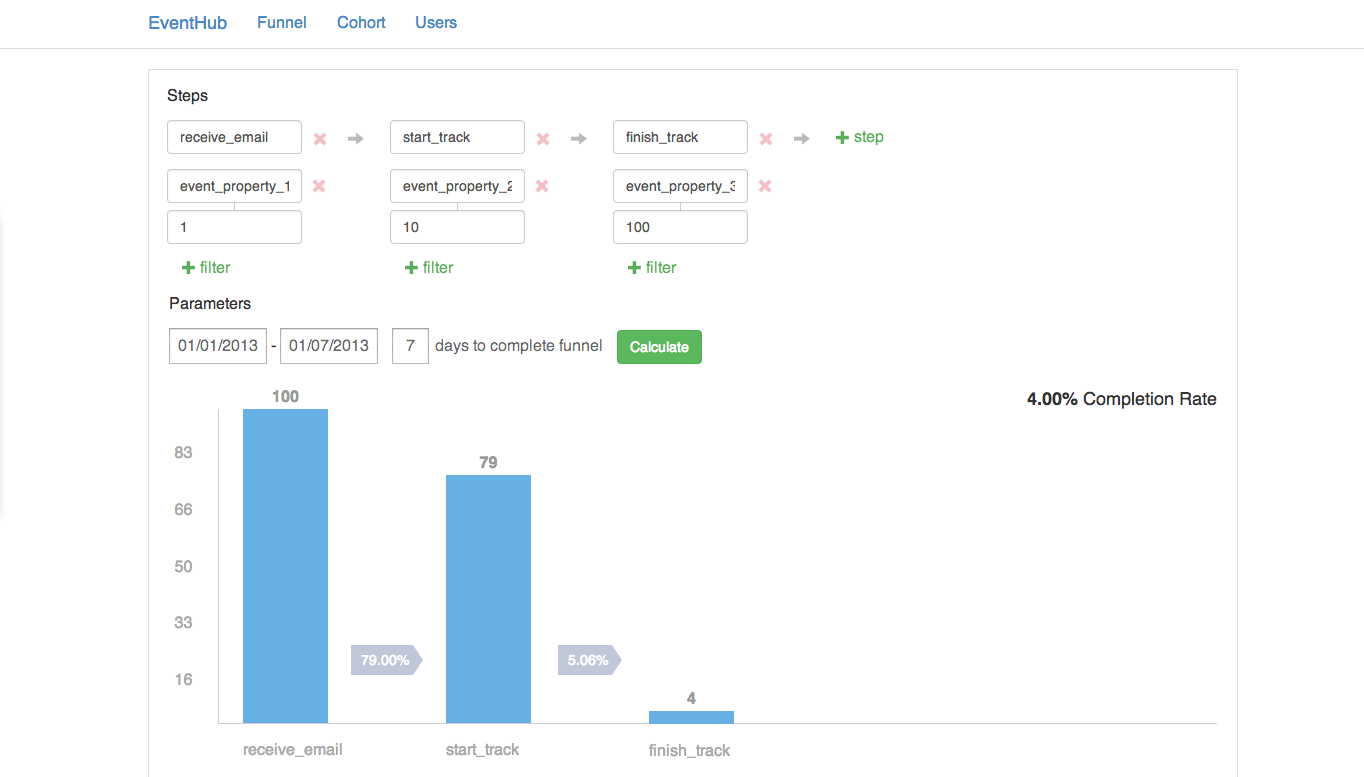
funnel screenshot
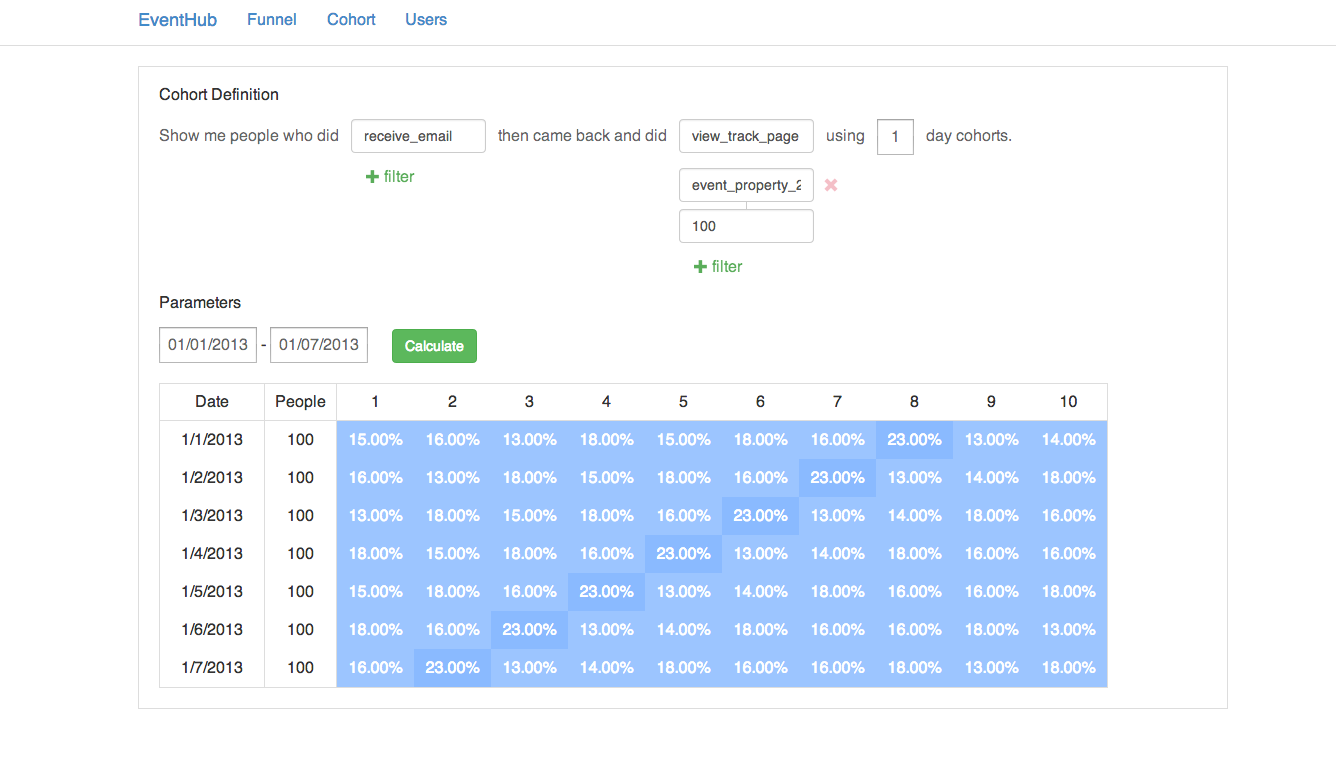
cohort screenshot

Architecture Overview

  1. Basic funnel queries only requires two indices, a sorted map from (event_type and event_time) pair to events, and a sorted map from (user and event_time) pair to events

  2. Basic cohort queries only requires one index, a sorted map from (event_type and event_time) pair to events.

  3. A/B testing and power analysis are simply statistics calculation based on funnel conversion and pre-determined thresholds

Therefore, as long as the two indices in the first bullet point fit in memory, all basic analysis (queries by event_types and date range) can be done efficiently. Now, consider a hypothetical scenario in which there are one billion events and one million users. A sorted map implementation like AVL tree, RB tree, SkipList, etc. can be dismissed as the overhead of pointers would be prohibitively large. On the other hand, B+tree may seem to be a reasonable choice. However, since events are ordered and stored chronologically, sorted parallel arrays would be a much more space efficient and simpler implementation. That is, the first index from (event_type and event_time) pair to events can be implemented as having one array storing event_time for each event_type and another parallel array storing event_id, and similarly for the other index. Though separate indices are needed for looking up from event_type or user to their corresponding parallel arrays, as event_type and user are level of magnitude smaller than events, the space overhead is negligible.

With parallel array indices, the amount of memory needed is approximately (1B events * (8 bytes for timestamp + 8 bytes for event id)) * 2 = ~32G, which still seems prohibitively large. However, one of the biggest advantage of using parallel arraysis that within each array, the content is homogeneous and thus compression friendly. The compression requirement here is very similar to compressing posting list in search engines, and with algorithm like p4delta, the compressed indices can be reasonably expected to be <10G. In addition, EventHub made another important assumption that date is the finest granularity. As event id is assigned monotonically increasingly, the event id itself can then be thought of as some logical timestamp. As EventHub maintains another sorted map from date to the smallest event id on that date, all the queries filtered by date range can be translated to queries filtered by event id range. With that assumption, EventHub was able to get rid of the time array and further reduced the index size by half (<5G). Lastly, since indices are event_ids stored chronologically in an array, plus the array is stored as memory mapped file, the indices are very friendly to kernel page cache. Also, assuming most of the analysis only cares about recent events, as long as those tail of the indices can fit in the memory, most of the analysis can still be computed without touch disks.

At this point, as the size of the basic indices is small enough, EventHub would be able to answer basic funnel and cohort queries efficiently. However, since, there are no indices implemented for other properties on events, in case of queries filtered by event properties other than event_type, EventHub still needs to look up the event properties from disk and filter events accordingly. Due to the space and time complexity needed for this type of query is not easy to estimate analytically, but in practice, when we ran our internal analysis at Codecademy, the running time for most of the funnel or cohort queries with event properties filter is around few seconds. To optimize the query performance, the followings are some key features implemented and more details can be found from the repository.

  1. Each event has a bloomfilter to quickly reject event property which doesn't exactly match the filter

  2. LRU Cache for events

Assuming the bloomfilters are in memory, EventHub only needs to do disk lookup for events that actually match the filter criteria (true positive) as well as the false positive events from bloomfilters. As, the size of bloomfilters can be configured, the false positive rate can be adjusted accordingly. Additionally, since most of the queries only involves recent events, to optimize the query performance, EventHub also keeps a LRU cache for events. Alternatively, EventHub could have implemented inverted index like search engines do to facilitate fast equality filters. The primarily reason for adopting bloomfilters with cache is that it doesn't require adding more posting list as new event properties are added, and we believe for most use cases and with proper compression, EventHub can easily cache hundreds of million of events in memory and achieve low query latency.

Lastly, EventHub as is doesn't compress the index and we left that as one of our todo. In addition, the following two features can be easily added to achieve higher throughput and lower latency if that's needed.

  1. Event properties can be stored as column oriented which will allow high compression rate and great cache locality

  2. Events from each user in funnel analysis, cohort analysis, and A/B testing are independent. As a result, horizontal scalability can be trivially achieved from sharding by users.

As always, it's open sourced, and pull requests are highly welcome.

If you like the post, you can follow me (@chengtao_chu) on Twitter or subscribe to my blog "ML in the Valley". Also, special thanks Bob Ren (@bobrenjc93) for reading a draft of this 

Why building a data science team is deceptively hard

More and more startups are looking to hire data scientists who can work autonomously to derive valuable insights from data. In principle, this sounds great: engineers and designers build the product, while data scientists crunch the numbers to gain insights. In practice, finding these data scientists and enabling them to be productive are very challenging tasks.

Before diving further, it's useful to note a few trends in data and product development that have emerged over the past decade:
  • Companies such as Google, Amazon and Netflix have shown that proper storage and analysis of data can lead to tremendous competitive advantages.

  • It’s now feasible for startups to instrument and collect vast amounts of usage data. Mobile is ubiquitous, and apps are constantly emitting data. Big data infrastructure has matured, which means large-scale data storage and analysis are affordable.

  • The widely adopted lean startup philosophy has shifted product development to be much more data-driven. Startups now face the challenges of defining Key Performance Indicators (KPI), designing and implementing A/B tests, understanding growth and engagement funnel conversion, building machine learning models, etc.

Because of these trends, startups are eager to develop in-house data science capabilities. Unfortunately many of them have the wrong ideas about how to build such a team. Let me describe three popular misconceptions.

Misconception #1: It's okay to compromise the engineering bar for statistical skills.

For data scientists to work productively and independently, they must be able to navigate the entire technical stack and work effectively with existing systems to extract relevant data. The only exception is if a startup has already built out its data infrastructure. But in reality, very few startups have their infrastructure in place before building a data science team. In these cases, a data science team without strong engineering skills or engineering support will have a hard time doing their job. At best, they will produce suboptimal solution that will be rewritten by another team for production.

To illustrate this, take the example of building the KPI dashboard at Codecademy. Before visualizing the data in d3, I had to extract and join (a) user data from MongoDB, (b) cohort data from Redis, and (c) pageview data from Google Analytics. The data collection alone would've been near impossible without an engineering background, let alone making the dashboard real-time, modularized and reusable.

Misconception #2: It's okay to compromise the statistics bar for engineering skills.

Proper interpretation of data is not easy, and misinterpreted data can do more damage than data that's not interpreted at all (check out "Statistics done wrong"). Building useful machine learning (ML) models is trickier than most people expect. A popular but misguided view holds that ML problems can be solved either by applying some black box algorithm (a.k.a magic), or by hiring interns who are PhD students. In practice, hundreds of decisions and tradeoffs are made in solving such problems, and knowing which decisions to make requires a lot of experience. (I’ll expand upon this more in a future post titled “Machine learning done wrong”.) For a given ML problem, there are tens if not hundreds of way to solve it. Each solution makes different assumptions and it's not obvious how to navigate and identify which assumptions are reasonable and which model should be used. Some would argue: why not just try all different approaches, cross validate, and see which one works the best? In reality, you never have the bandwidth to do so. A strong data scientist might be able to produce a sensible model right off the bat, while a weak one might spend months optimizing the wrong model without knowing where the problem is.

Misconception #3: It's okay to hire data scientists who lack product thinking.

Imagine asking someone who doesn't have a holistic view of the product to optimize your business KPIs. They may prematurely optimize the sign up funnel before making sure the product has reasonable retention, which would lead to more unretained users. Some think data-driven product development is a local optimization. This criticism is only correct when those who drive product development with data fail to think about the product holistically.

To sum up, a productive data science team requires data scientists that are strong in engineering, statistics, and product thinking. It's hard. And it becomes even harder to look for the first data science hire who will be spearheading data efforts in a startup. For startups that don't have the luxury to wait and hire these rare data scientists, it's important to be aware of the compromises made especially in terms of the hiring bar. Before the data team is strong enough across all three areas, make sure they have strong support for the skills they lack, and don't expect them to work autonomously.

If you like the post, you can follow me (@chengtao_chu) on Twitter or subscribe to "ML in the Valley". Also, special thanks Ian Wong (@ihat), Leo Polovets, and Bob Ren (@bobrenjc93) for reading a draft of this.